
Lazuli PDP Use Case Vol. 04: Visualizing Theoretical Inventory Through Data Matching and Linking Across Multiple Data Sources
In manufacturing and retail, it is important to analyze other companies’ sales strategies and understand your own sales performance. With Lazuli PDP’s data collection features, you can gather and structure information available on the web, making it possible to research competitors and track the sales status of your own products. In this article, we’ll introduce the details with examples.
At Lazuli, we address various issues related to product master and product data, such as the following.
Automatic generation of data for EC listings
Control and maintenance of attribute information
Competitive research through web crawling and optimization of our products’ sales by channel
Visualizing theoretical inventory by linking POS data from retailers with shipment data from wholesalers and manufacturers
Organizing product information to improve CX
This time, we will introduce “Visualizing theoretical inventory by linking POS data from retailers with shipment data from wholesalers and manufacturers,” along with examples of its use in manufacturing and retail.
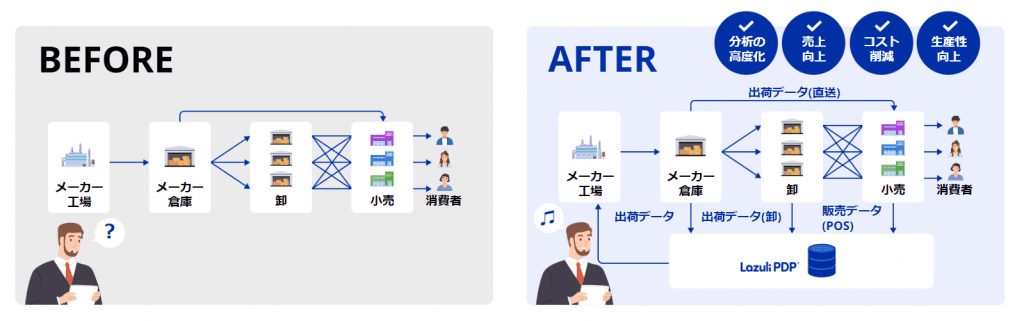
Traditionally, when manufacturers shipped products to wholesalers or retailers, it was difficult to track inventory status thereafter, making it impossible to grasp in-store inventory conditions. If this situation continues as sales channels diversify, it is likely to lead to lost sales opportunities due to an inability to respond to stock shortages, a decline in production efficiency due to overproduction, and increased environmental impact due to more food loss.
Therefore, Lazuli has begun an initiative to link manufacturers’ and wholesalers’ shipment data with retailers’ POS data to visualize theoretical inventory.
From visualizing theoretical inventory in stores, we aim to strengthen profitability by advancing the optimization of our own plans and execution for production, sales, and distribution.
In fact, this initiative is being carried out at Company E, a manufacturer.
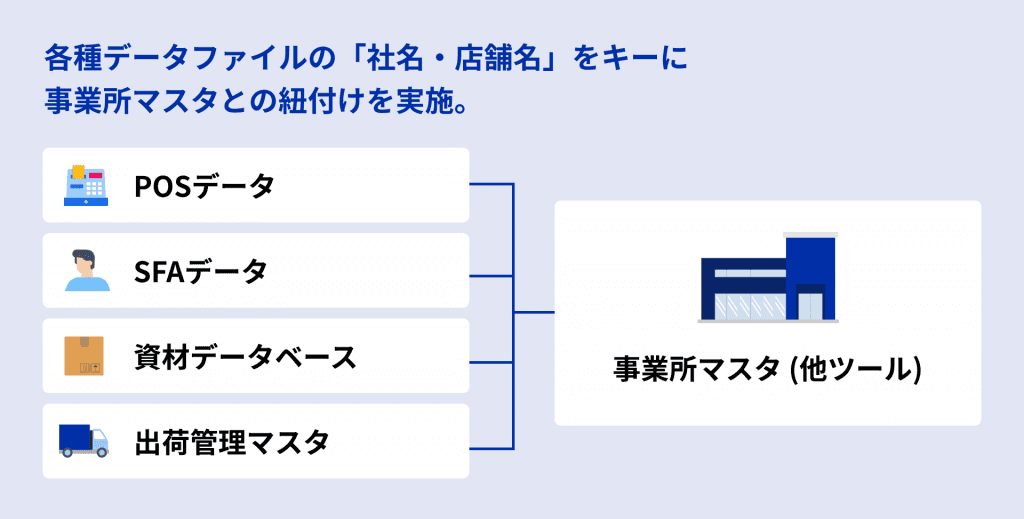
Until now, Company E had issues involving the time and cost required to obtain shipment data from wholesalers and sales data from retailers. In addition, even when data could be obtained, variations in how items were written across datasets required complex record matching, and the critical data could not be linked, making visualization impossible.
So, using the core technology of Lazuli PDP, we are carrying out record matching across datasets and integrating data for analysis, and moving forward with efforts to visualize theoretical inventory.
At Company E, by visualizing theoretical inventory in stores, the company aims to control the appropriate production volume and reduce food loss and food waste. In addition, based on inventory data by sales floor, it will be possible to analyze sales differences between stores and their causes, aiming to improve sales.
Going forward, the company plans to use data more extensively not only to reduce food loss, but also for product development and sales strategies.
Lazuli PDP can enable not only such visualization of theoretical inventory, but also numerical forecasting through linking multiple datasets and the use of data for marketing initiatives.
For related case studies and other diverse ways of using product data, please see below or contact us through our website.
LOTTE Co., Ltd. Press Release:https://corporate.lazuli.ninja/news/lotte-starts-using-lazuli-pdp/
If you have challenges such as “I want to visualize data to achieve efficient business operations” or “data utilization is not progressing as hoped,” please contact us.
https://corporate.lazuli.ninja/contact/
Examples of product data utilization in the manufacturing industry:https://corporate.lazuli.ninja/useful/manufacturer_clients_best_practices/
Examples of product data utilization in the retail industry:https://lazuli.ninja/useful/retail_clients_best_practices/