Waseda University, Graduate School of Political Science and Economics
Professor Ueda of Waseda University tackles the evolution of price index research ─ Visualizing the reality of consumption through Lazuli's "Dining Out AI Research".
The product data provided by Lazuli is valuable information not only for businesses but also for academic purposes. Professor Kozo Ueda from Waseda University’s Graduate School of Political Science and Economics has utilized the data from Lazuli's "Dining Out AI Research" for price research starting from February 2025, and it has been found that this data is useful for analyses such as the creation of price indices.
Challenges before implementation
Unable to obtain detailed data on service industry pricing and sales volume.
Effects after implementation
Utilizing POS data from restaurants provided by dining-out AI research for price index studies. Successfully grasped detailed consumer trends using various indices.
Utilizing Detailed Data Not Available in the Consumer Price Index
——First, could you tell us about Dr. Ueda's background?
He worked on macroeconomic research at the Bank of Japan for 14 years. Among various topics, "prices" is particularly important as it influences the Bank's monetary policy. After retiring from the Bank of Japan in 2013, he became a faculty member at Waseda University and continues to research monetary policy.
Data on visible "goods" is relatively easy to obtain, and for example, the analysis of POS data from supermarkets and convenience stores has been progressing for some time. However, data on invisible "services" is more difficult to obtain, posing challenges for detailed analysis. While searching for a solution, we found "Restaurant AI Research" on the internet and reached out to Lazuli.
There are other price data for services, such as the Consumer Price Index (CPI) announced monthly by the Ministry of Internal Affairs and Communications. However, the CPI only deals with popular items. The survey on items other than a few popular products, as well as small and medium-sized enterprises or individual stores, is insufficient and cannot necessarily represent the overall data.
——Having actually looked at the data from "Restaurant AI Research," what aspects did you find useful?
By breaking it down to items, single orders, tables, stores, and detailed levels, you can obtain price data as well as sales quantity data that is not included in the Consumer Price Index. Based on aggregating these, the movements of prices and quantities over time can be indexed as price indices, quantity indices, etc., which is the characteristic of analysis using "Restaurant AI Research" data. This enables detailed analysis. For example, trends can be analyzed by separating food and drinks, or by comparing data by type of store and price range, creating various indices to visualize consumption trends.
Additionally, the fluctuations of the government’s Consumer Price Index and the aggregated price index of all items from "Restaurant AI Research" are almost identical. Statistically, it can be said that there is little bias and the data is reliable.
(Professor Kozo Ueda, Waseda University, Graduate School of Political Science and Economics)
Unexpected Consumption Behaviors Revealed Through Analysis of Various Indices
——Have you made any new discoveries by utilizing the data from "Restaurant AI Research" in your research?
This time, we were provided data from January 2023 to December 2024 and analyzed it.
As mentioned earlier, comparing the price fluctuations of food and drinks over two years reveals that the price index for drinks has risen more slowly. It can be speculated that the demand for drinks is weaker, and increasing the price would lead to a decrease in quantity sold.
The price indices by genre saw significant increases in izakayas, yakitori, and yakiniku, while Italian food was limited to small fluctuations. By price range, a higher price index increase was observed in low-priced stores.
Additionally, actual prices are deeply related to changes in content and quality. For example, even if prices remain unchanged, if the service provider reduces the quantity or lowers the quality, it effectively becomes a price increase. How to capture this aspect is one of the challenges of price research.
Therefore, this time I analyzed the amount paid per group as the table index. Even if prices are the same, if the quantity is reduced, customers will want to eat more to feel satisfied. Thus, it is natural for the table index to rise.
Comparing the price indices of items with the table index using the "Restaurant AI Research" data showed that the latter had a slightly higher growth rate. This suggests that by reducing quantity, a substantial price increase is taking place beyond the apparent price.
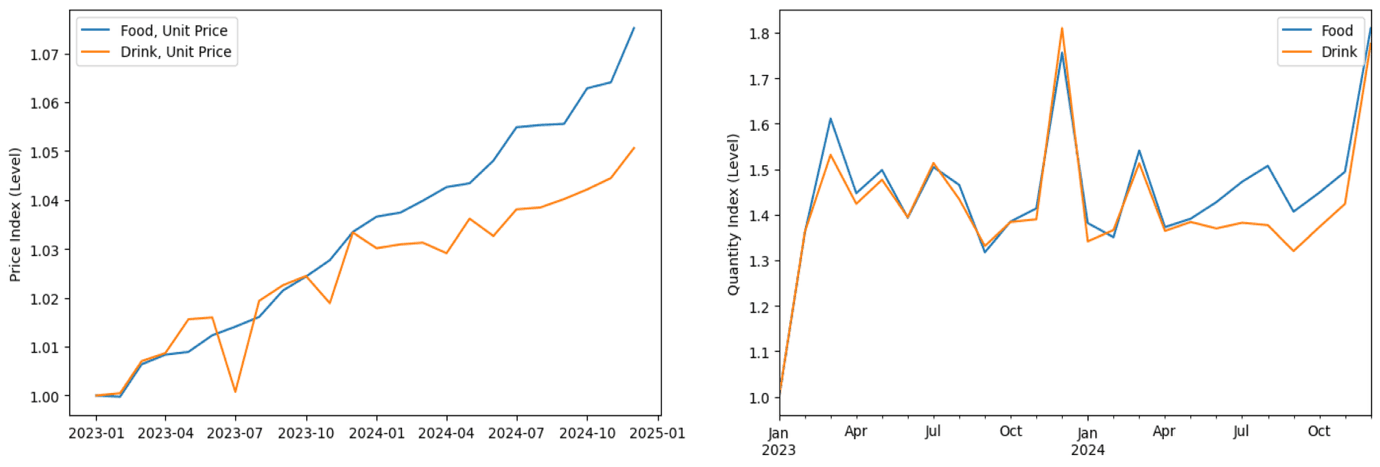
(Example: Using indices separated into food and beverage suggests a gradual increase in beverages)
Furthermore, comparing the table index by group size revealed an interesting finding. December is the season when restaurant sales peak annually. It has been believed that this is due to increased customer numbers from the demand for large year-end parties, but that is not the only reason. The table index also increases compared to other months, not only for larger groups but also for pairs and individuals.
This means customer spending per person increases in December. Including families and couples, it can be presumed that wallets loosen during Christmas and the New Year, leading to extravagant spending.
Reflecting Timely Data and Flexible Analysis in Policy
——How can POS data like that provided by "Restaurant AI Research" be reflected in policy in the future?
I believe it is essential to create various indices in a timely manner. The Consumer Price Index is announced only once a month and has about a two-week time lag.
With "Restaurant AI Data," it is possible to obtain data from the previous week and perform analysis from various angles as discussed here. This will enable timely understanding of price trends and reflect them in monetary policy.
——What are Dr. Ueda's future prospects, and what do you expect from Lazuli?
I believe initiatives like this one represent a good form of collaboration between industry and academia. The business of companies and contributions to social infrastructure through academia align well.
Personally, I would like to give back the results of my macroeconomic research, in which I have a keen interest, to society in any way possible. I hope to tackle new research utilizing data that stimulates intellectual curiosity like this.
———————————————————————————————-
What is Restaurant AI Research?
"Restaurant AI Research" is a service that integrates POS data from over 1,500 dining establishments and provides it in an easily manageable form. Based on a vast amount of dining POS data, it enables analysis along various axes such as prices and sales quantities of drinks and food, number of customers, and average spending per customer. Data from up to the previous week is reflected, allowing timely understanding of dining trends.